Global map of Carbon dioxide (CO2) emissions from fossil fuels and industry. Land use change is not included.[1]Annual CO2 emissions by region. This measures fossil fuel and industry emissions. Land use change is not included.[2]The US, China and Russia have cumulatively contributed the greatest amounts of CO2 since 1850.[3]
This is a list of sovereign states and territories by carbon dioxide emissions[n 1] due to certain forms of human activity, based on the EDGAR database created by European Commission and Netherlands Environmental Assessment Agency. The following table lists the 1970, 1990, 2005, 2017 and 2022 annual CO2 emissions estimates (in kilotons of CO2 per year) along with a list of calculated emissions per capita (in tons of CO2 per year).[4]
The data only consider carbon dioxide emissions from the burning of fossil fuels and cement manufacture, but not emissions from land use, land-use change and forestry.[n 2] Over the last 150 years, estimated cumulative emissions from land use and land-use change represent approximately one-third of total cumulative anthropogenic CO2 emissions.[7] Emissions from international shipping or bunker fuels are also not included in national figures,[8] which can make a large difference for small countries with important ports.
In 2022, CO2 emissions from the top 10 countries with the highest emissions accounted for almost two thirds of the global total. Since 2006, China has been emitting more CO2 than any other country.[9][10][11] However, the main disadvantage of measuring total national emissions is that it does not take population size into account. China has the largest CO2 emissions in the world, but also the largest population. Some argue that for a fair comparison, emissions should be analyzed in terms of the amount of CO2 per capita.[12] Their main argument is illustrated by CO2 per capita emissions in 2022, China's levels (8.85) are almost half those of the United States (14.44) and less than a sixth of those of Palau (59.00 – the country with the highest emissions of CO2 per capita).[13][4]
Measures of territorial-based emissions, also known as production-based emissions, do not account for emissions embedded in global trade, where emissions may be imported or exported in the form of traded goods, as it only reports emissions emitted within geographical boundaries. Accordingly, a proportion of the CO2 produced and reported in Asia and Africa is for the production of goods consumed in Europe and North America.[14]
Greenhouse gases (GHG) – primarily carbon dioxide but also others, including methane and chlorofluorocarbons – trap heat in the atmosphere, leading to global warming. Higher temperatures then act on the climate, with varying effects. For example, dry regions might become drier while, at the poles, the ice caps are melting, causing higher sea levels. In 2016, the global average temperature was already 1.1°C above pre-industrial levels.[15]
Total CO2 emissions by country/region in 2017 vs per capita emissions (top 40 countries)
Total CO2 emissions for the period 1970 to 2017 and 2017 emissions, by country/region
Historical greenhouse gas emissions 1990-2018 from Climate Watch[21]
CO₂ emissions per capita, 2016
Annual CO₂ emissions in 2017, measured in tonnes per year
Consumption-based CO₂ emissions per capita, 2017
Who emits the most CO2 each year? Source: Our World in Data (2017)
Countries by carbon dioxide emissions in thousands of tonnes per annum, via the burning of fossil fuels (blue the highest and green the lowest). Based on levels in 2006.
Historical annual CO2 emissions for the top six countries and confederations
Worldwide CO2 Emissions in 2021, by region, per capita, growth. Visualization in a variwide diagram
^Carbon dioxide (CO2) is a colourless, odourless and non-poisonous gas formed by combustion of carbon and in the respiration of living organisms and is considered a greenhouse gas. Emissions means the release of greenhouse gases and/or their precursors into the atmosphere over a specified area and period of time. Carbon dioxide emissions or CO2 emissions are emissions stemming from the burning of fossil fuels and the manufacture of cement; they include carbon dioxide produced during consumption of solid, liquid, and gas fuels as well as gas flaring
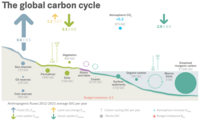
^Global Carbon Project (2022)[5] The rate of build-up of carbon dioxide (CO2) in the atmosphere can be reduced by taking advantage of the fact that atmospheric CO2 can accumulate as carbon in vegetation and soils in terrestrial ecosystems. Under the United Nations Framework Convention on Climate Change any process, activity or mechanism which removes a greenhouse gas (GHG) from the atmosphere is referred to as a "sink". Human activities impact terrestrial sinks, through land use, land-use change and forestry (LULUCF), consequently, the exchange of CO2 (carbon cycle) between the terrestrial biosphere and the atmosphere is altered.[6]
^Greenhouse gases (GHG) constitute a group of gases contributing to global warming and climate change.
The Kyoto Protocol, an environmental agreement adopted by many of the parties to the United Nations Framework Convention on Climate Change (UNFCCC) in 1997 to curb global warming, nowadays covers seven greenhouse gases:
the non-fluorinated gases:
carbon dioxide (CO2),
methane (CH4),
nitrous oxide (N2O),
the fluorinated gases:
hydrofluorocarbons (HFCs),
perfluorocarbons (PFCs),
sulphur hexafluoride (SF6),
nitrogen trifluoride (NF3).
Converting them to carbon dioxide (or CO2) equivalents makes it possible to compare them and to determine their individual and total contributions to global warming.
^ abcCrippa, M.; Guizzardi, D.; Pagani, F.; Banja, M.; Muntean, M.; Schaaf, E.; Becker, W.; Monforti-Ferrario, F.; Quadrelli, R.; Risquez Martin, A.; Taghavi-Moharamli, P.; Köykkä, J.; Grassi, G.; Rossi, S.; Brandao De Melo, J.; Oom, D.; Branco, A.; San-Miguel, J.; Vignati, E. (2023). GHG emissions of all world countries – 2023. Luxembourg: Publications Office of the European Union. doi:10.2760/953322. Retrieved 1 November 2023.
^Global Carbon Project (2022) Supplemental data of Global Carbon Budget 2022 (Version 1.0) [Data set]. Global Carbon Project. https://doi.org/10.18160/gcp-2022
^Schrooten, L; De Vlieger, Ina; Int Panis, Luc; Styns, R. Torfs, K; Torfs, R (2008). "Inventory and forecasting of maritime emissions in the Belgian sea territory, an activity based emission model". Atmospheric Environment. 42 (4): 667–676. Bibcode:2008AtmEn..42..667S. doi:10.1016/j.atmosenv.2007.09.071. S2CID93958844.


 Total CO2 emissions by country/region in 2017 vs per capita emissions (top 40 countries)
 Total CO2 emissions for the period 1970 to 2017 and 2017 emissions, by country/region
![Historical greenhouse gas emissions 1990-2018 from Climate Watch[21]](//upload.wikimedia.org/wikipedia/commons/thumb/4/4f/Historical_Greenhouse_Gas_Emissions_from_Climate_Watch.png/180px-Historical_Greenhouse_Gas_Emissions_from_Climate_Watch.png) Historical greenhouse gas emissions 1990-2018 from Climate Watch[21]
Historical greenhouse gas emissions 1990-2018 from Climate Watch[21]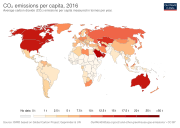 CO₂ emissions per capita, 2016
 Annual CO₂ emissions in 2017, measured in tonnes per year
 Consumption-based CO₂ emissions per capita, 2017
 Who emits the most CO2 each year? Source: Our World in Data (2017)
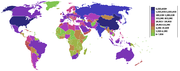 Countries by carbon dioxide emissions in thousands of tonnes per annum, via the burning of fossil fuels (blue the highest and green the lowest). Based on levels in 2006.
 Historical annual CO2 emissions for the top six countries and confederations
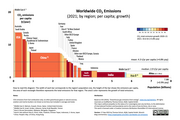 Worldwide CO2 Emissions in 2021, by region, per capita, growth. Visualization in a variwide diagram
.svg)

![Historical greenhouse gas emissions 1990-2018 from Climate Watch[21]](/wiki/File:Historical_Greenhouse_Gas_Emissions_from_Climate_Watch.png)
.svg)


;_variwide_diagram.png)